









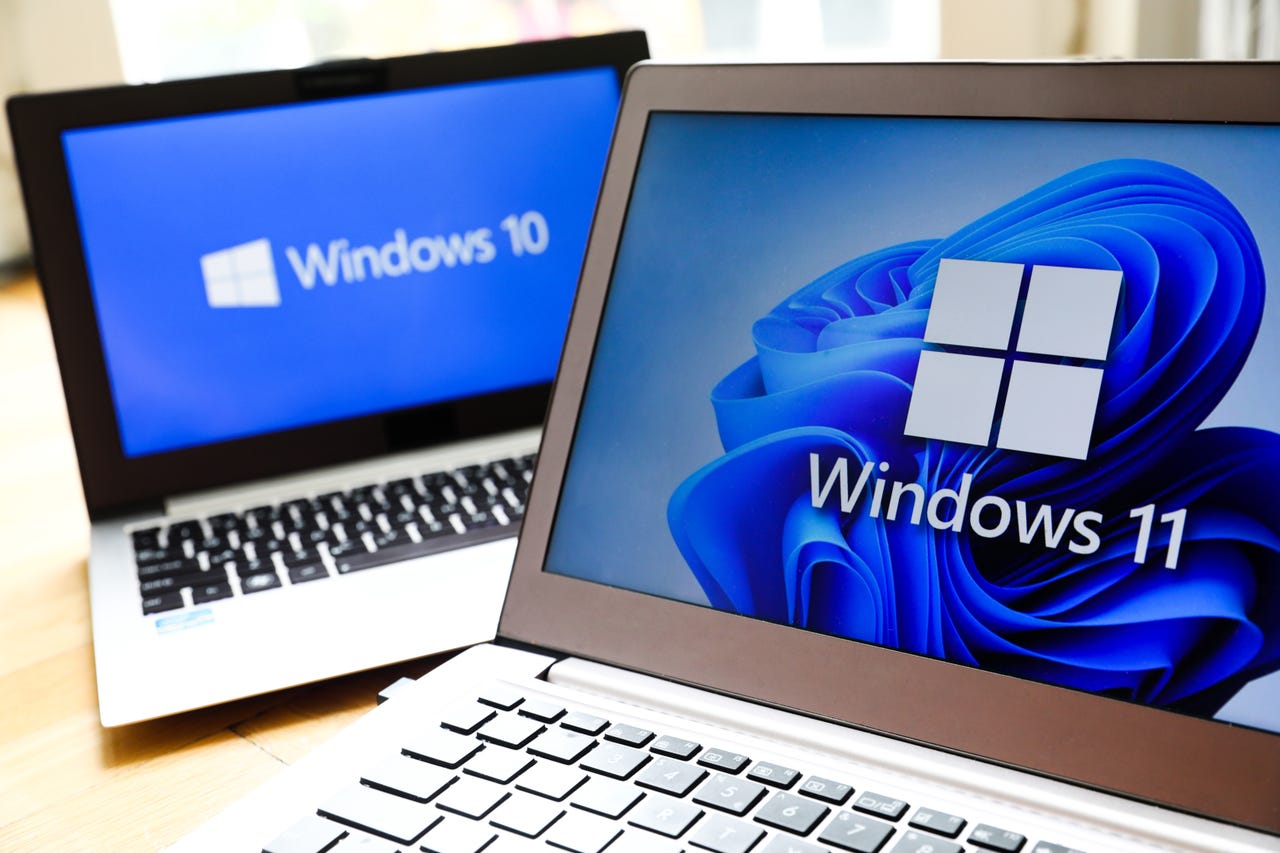
 Photo by Beata Zawrzel/NurPhoto via Getty Images
 Personal computers used to be the domain of hobbyists, who had no problem rolling up their sleeves and diving into debuggers to figure out why something wasn't working as expected.
Also: Yes, you can still get a free Windows 10 upgrade. Here's how
Today, PCs are business productivity tools designed for an audience that has neither the patience nor the technical background to fiddle with code or go spelunking in the registry when something goes wrong. If that's you, then you'll be pleased to know that there are a handful of built-in diagnostic and repair tools in Windows 10 and Windows 11 that can get you back to work quickly. They offer a wealth of troubleshooting information as well as (if you're lucky) easy solutions.
Even if you think you know these troubleshooting tools, keep reading. You might discover a new trick or two.
The name of this app, which dates back to the earliest days of Windows, seriously undersells its value in the modern era. Yes, it offers a list of running programs, complete with a way to terminate an app with extreme prejudice if that app starts misbehaving.
But it also has some excellent performance-monitoring capabilities that can help you figure out why your laptop is suddenly struggling. And it doesn't require any sophisticated technical knowledge.
Right-click any empty space on the taskbar and click Task Manager. Or open the Quick Link menu (right-click Start or press Windows key + X), and click the Task Manager entry. Or use Task Manager's keyboard shortcut, Ctrl + Shift + Esc.
Also: The ultimate Windows troubleshooting trick
In Windows 11, Task Manager has a navigation menu on the left, with each option representing a different page.Usethose options to quickly switch from the Processes page, with its per-app view of resource usage, to the Performance tab, which offers yet another set of tabs, each with a very detailed view of CPU, Memory, Disk, Network, and GPU usage.
Click any heading to sort the items by that value and show which are using the most CPU, memory, and so on.
Screenshot by Ed Bott/If you keep this graph open as you work, you can see how hard your CPU, memory, and disks are working.
Screenshot by Ed Bott/And look! In Windows 11, you can use Task Manager in dark mode.
There's a phenomenal amount of detail on each Task Manager tab. Armed with that information, you can:
If you want Task Manager to always open showing a specific tab, click Settings in the lower left corner and specify your choice from the Default Start Page. (In Windows 10, use the Options > Set Default Tab menu.) On this page, you'll also find an option to speed up, slow down, or pause the real-time counters on the Performance page.
There's usually a pretty big gap between the battery life a PC manufacturer claims for the laptop it's trying to sell you and what you end up getting. So, how do you get a more accurate picture of your actual battery usage, and how can you tell whether an app is using more of your battery than it has a right to?
Also: Windows 11 setup: Which user account type should you choose?
That's where the Power Settings Command-Line Tool (Powercfg.exe) shows its strengths.
Open a PowerShell or Command Prompt window and then typepowercfgfollowed by the command you want to run. For a full list of what commands are available, typepowercfg /?and then press Enter.
To run Powercfg, you'll need to open a command window (like Terminal or PowerShell).
Screenshot by Ed Bott/Find out why your PC drains the battery instead of sleeping.If your system refuses to go to sleep (or wakes up inappropriately), the cause is usually an app or service that refuses to respond to a request from the system for sleep. Use the commandpowercfg /requeststo see which process is the culprit.
Last year, I had a Windows laptop that kept waking up when it should have been sleeping peacefully. The culprit was a program called dptf_helper.exe, which is part of the Intel Dynamic Platform and Thermal Framework Utility Application. To solve this problem, I used the following command:
powercfg /requestsoverride PROCESS dptf_helper.exe DISPLAY SYSTEM
You can see the full syntax for this command by typing the following:powercfg /requestsoverride /?
Also: How to build a gaming PC for$550-ish
Get a detailed battery report. Use powercfg /batteryreportto generate a thorough report showing information about battery usage for the current device over time. Each battery report includes tables and charts showing recent usage, usage history, battery capacity over time, and battery life estimates. You don't need a deep technical background to gather useful information from this report.
For more on this command, as well as other tips for getting better battery life from your Windows PC, see "How to maximize the battery life of your Windows 10 PC".
When you open this app, you will get flashbacks to... well, let's call it 2006. Everything about it has the vintage look and feel of a long-gone Windows user experience, right down to the fact that it's a part of Control Panel, which is slowly being removed from modern versions of Windows.
And yet this tool hangs around, no doubt because someone in Redmond knows that it offers an indispensable display of troubleshooting information that even a nontechnical user can understand.
To open Reliability Monitor, just tap the Windows key or click Start and then start typingreli.That should be enough to display the View Reliability History shortcut. To create a one-click shortcut, right-click any empty space on the desktop and choose New > Shortcut; enterperfmon /relon the first page of the Create Shortcut wizard, give the shortcut a descriptive name (like Reliability Monitor) on the next page, and then click Finish.
This day-by-day display of important system events is an indispensable troubleshooting tool.
Screenshot by Ed Bott/The display is organized by day, with each day getting its own column in the top of the window. Icons show different types of failures as well as warnings you might receive. The last row, Information, can be useful as well. Instead of focusing on failures, it shows you activities like updates, app installations, and driver reconfigurations that were successful.
Find details about a crash.When an app crashes, you might not even be aware of it, especially if the app was designed to restart automatically after a failure. If Windows crashes, of course, you'll know about it, especially in the case of a Stop error, also known as abug checkor the Blue Screen of Death (BSOD). Whatever kind of crash you're troubleshooting, open its event in Reliability Monitor and look at the technical details (for a BSOD, that's a code like 0x3 DRIVER_POWER_STATE_FAILURE). Those details might be inscrutable, but they also might give you enough information to craft a specific search that can turn up a solution.
Identify possible causes of crashes or slowdowns.If an app (or Windows itself) started misbehaving recently, Reliability Monitor can help you answer a crucial troubleshooting question -- has anything changed lately? If the crashes or hangs started on the 10th, look at the Information line for that day and a few days earlier to see whether any new programs or drivers were installed or updated around the same time. Sometimes rolling back the driver installation or uninstalling the app can help determine whether it is causing the problems.
If you're troubleshooting someone else's PC, and want to get a quick survey of what kind of problems it's been experiencing, click View All Problem Reports at the bottom of the main program window. That displays a neatly formatted list, grouped by the source of the problem reports.
Also: How to downgrade from Windows 11 to Windows 10 (there's a catch)
Double-click any item in that list to see the technical details for the problem report. When you're working with technical support staff to debug a problem, use the Copy To Clipboard button at the bottom of one of these reports to copy those details and paste them into a trouble ticket or an email.
 Hot Tags :
Tech
Services & Software