








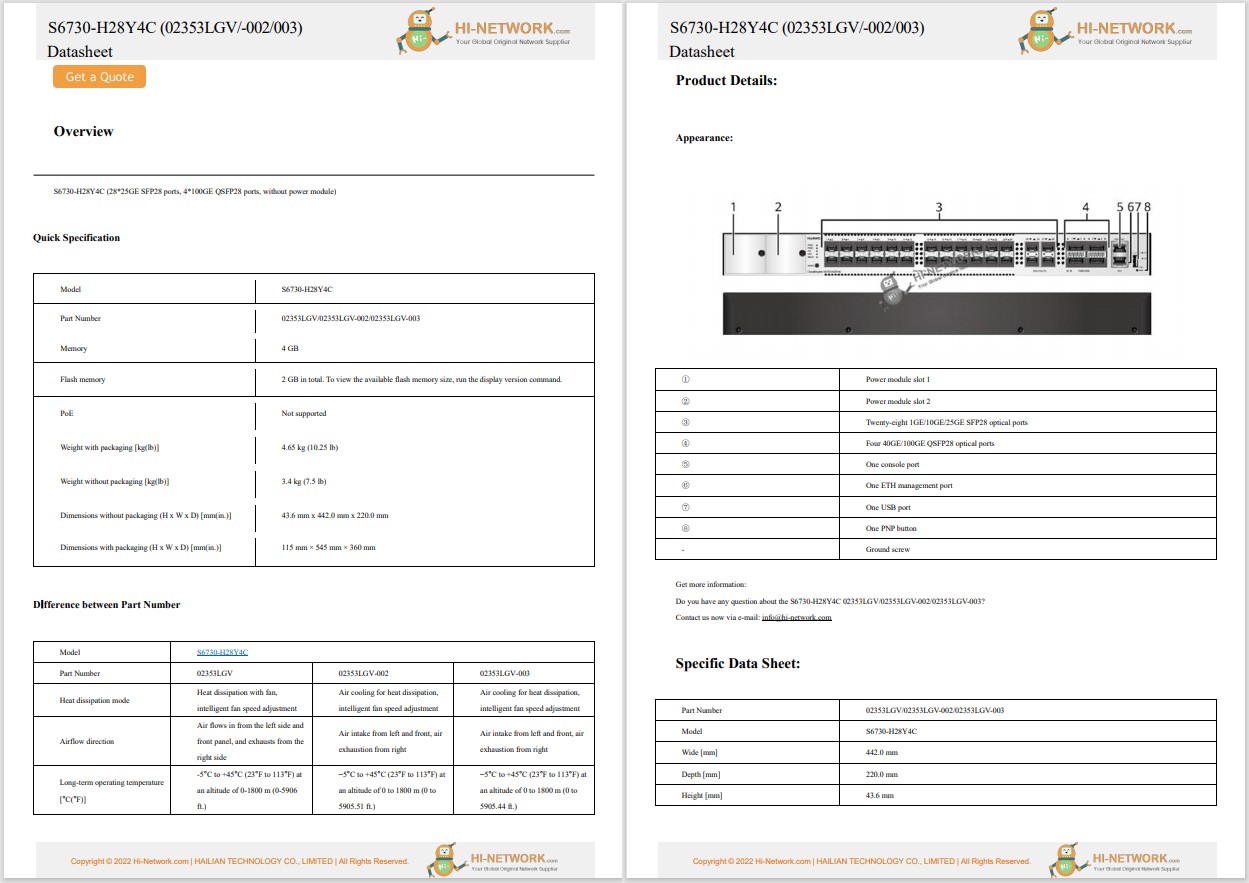


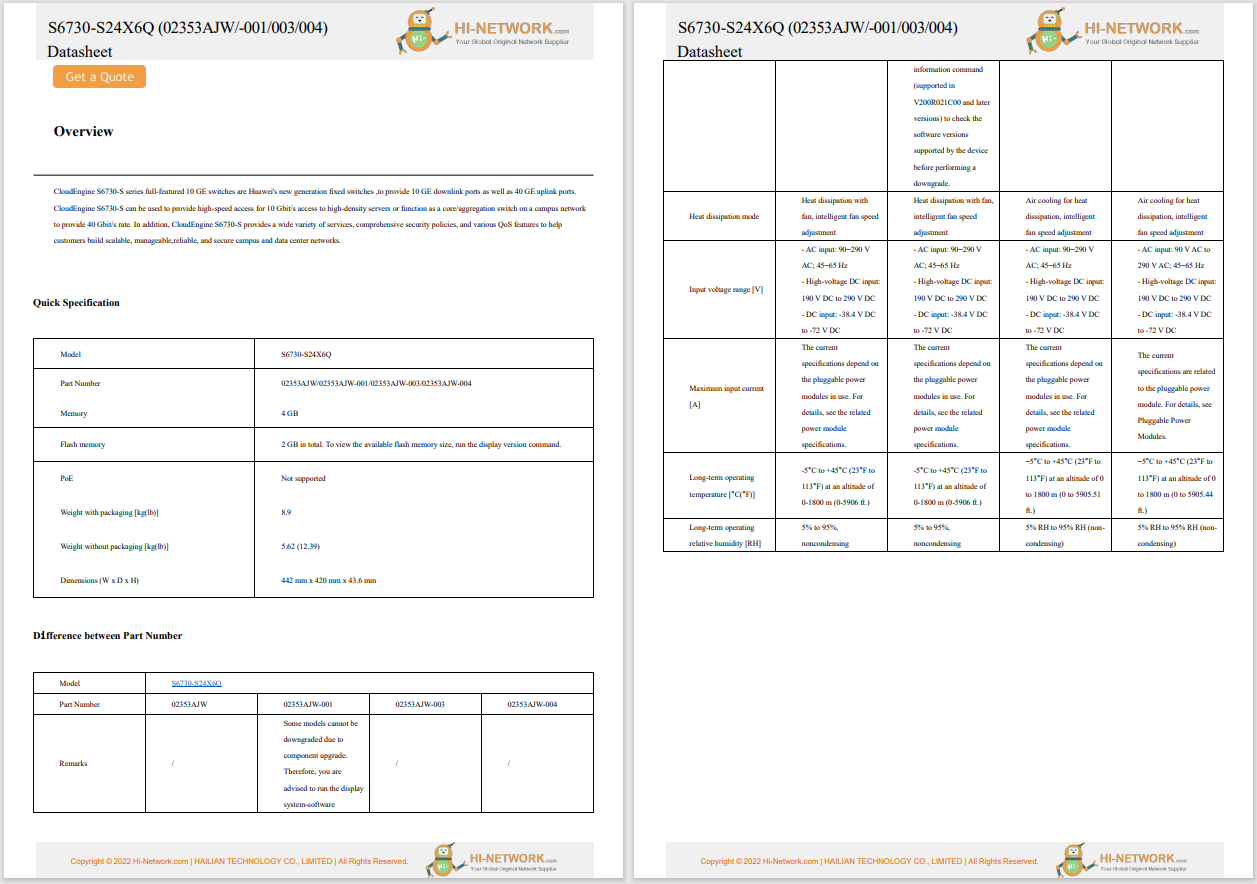

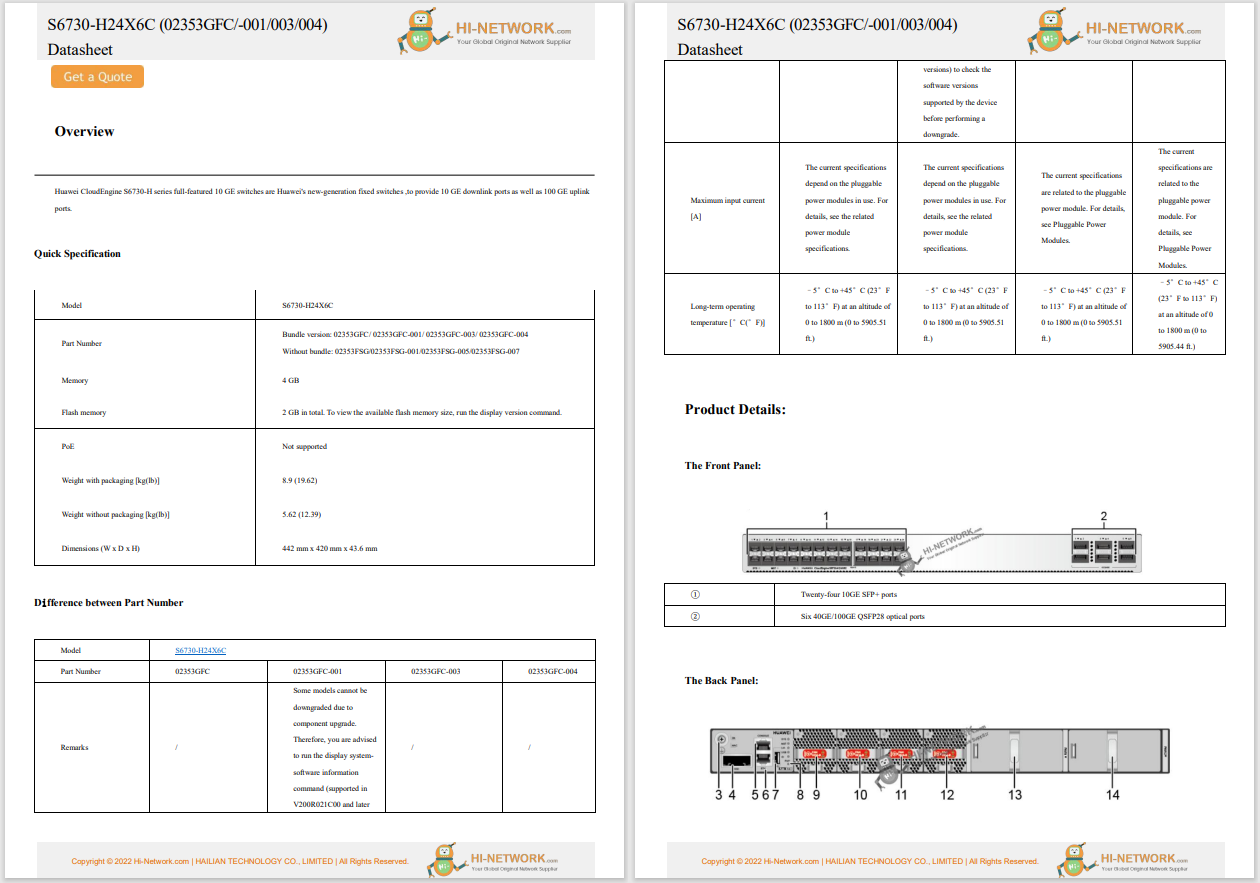

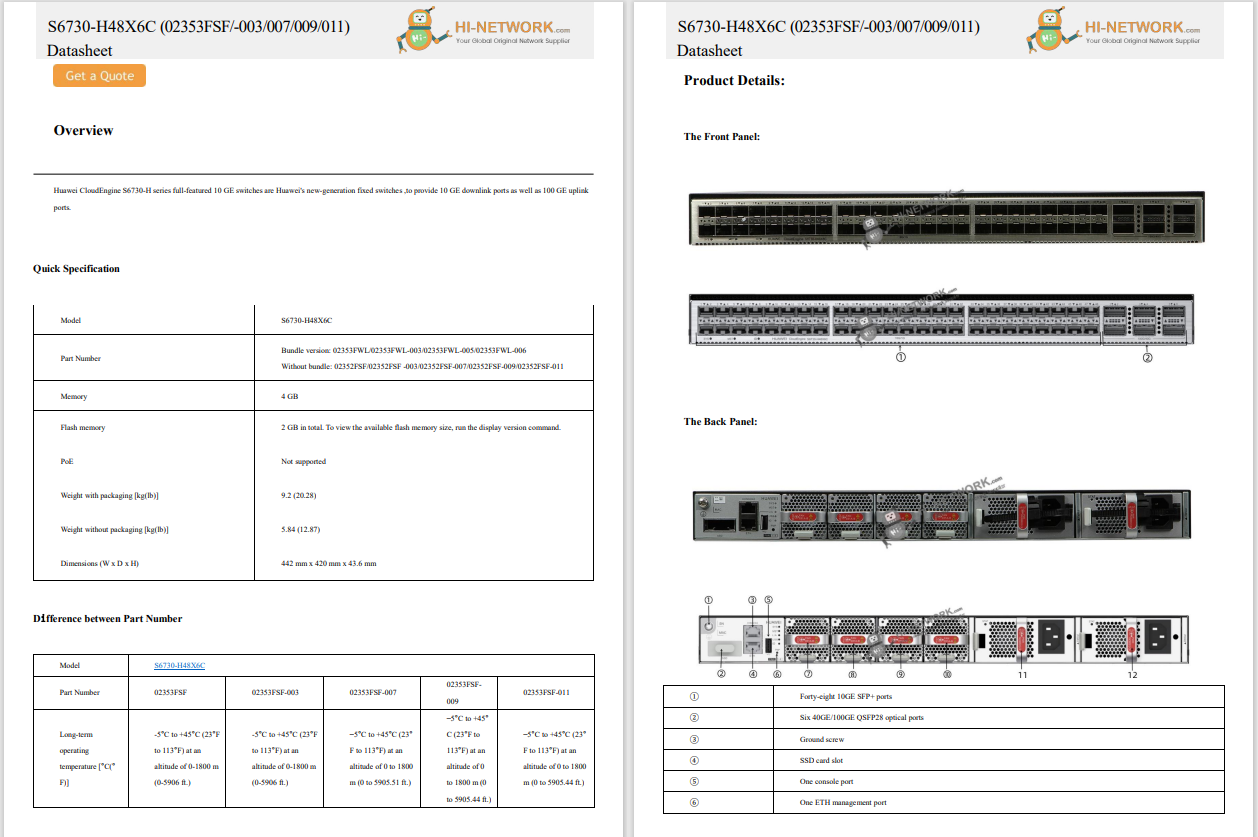















Here's what we're going to make.
David Gewirtz/Last week, when Apple introduced its new line of M3 processors, I set out to create a comparison table to introduce the M3s and compare them to the M2s and M1s. I built it with colors in Excel. While I hope that readers found the article helpful, I can't be sure -- because all the reader letters I received were about how I made the table.
Also: Does Apple's M3 chip obsolete the M1 and M2? Here's when to upgrade - and why
You can see the end result above. For the rest of this article, I'll walk you through the process of making it -worthy.
We'll start with a spreadsheet containing the table data, in Excel default format. I'm doing this on a Mac, but the steps are the same inExcel for Windows . Don't forget that you can click the little zoom rectangle in the upper right corner to see a larger version of any of these images.
To start off, I wanted to establish my color palette. I wanted the chart to reflect 's three main colors, the electric green, black, and the blue used when hovering over an active link. You can see that blue color by hovering over the logo on the upper left of any page.
I moved my mouse over the logo to force it to highlight, then used the screen capture tool on the Mac (Command-shift-4) to capture a block of the page. Then I pasted that block into my spreadsheet.
Don't worry about where this logo goes. We'll be getting rid of it in a minute.
I picked a cell a few lines below the bottom of the table, and then chose the drop-down arrow to the immediate right of the Paint Bucket tool. Then I selected More Colors.
I used the Eyedropper tool to hover over the green, and clicked. That dropped the green color in the swatch box.
I clicked OK, and filled the first cell with green. I repeated the process to get the proper blue and black. You don't really need to create three cells with each of the three colors because Excel keeps track of recent colors.
But I make a habit of creating cells with the color palette I'm using because then the colors travel with the document and aren't tied to the instance of Excel I happen to be using at the time.
As the final color step, I deleted the logo graphic from the sheet.
Also: These top drawing tablets are approved by digital artists and graphic designers
Next, I picked my font. I like the Helvetica Neue Condensed Bold font variation, so that's what I chose for the whole sheet.
The main body is Helvetica Neue Condensed Bold 9 and the left legend is Helvetica Neue Condensed Bold 10. The top legend is actually Helvetica Neue Bold 12 (not condensed).
As a quick formatting tweak, I centered all the main body text and scaled the entire sheet up to 220% so I'd easily be able to work on my additional tweaks. Here's where we are so far.
Next, it's time to apply the main colors. I chose the electric green as the background for the main body and for the header and sidebar text. Then I chose black as the header and sidebar background.
Already, you can see how this fits into 's color scheme.
I could have left the table like this and published it, but there are ways to make it more readable.
I wanted to be able to tighten up the cells. Since there was more than enough space inside the body, it was clear that the header needed to be compressed. This can be done quite nicely by angling the header text.
Angle the header text by first selecting all the top headers, then clicking the Orientation tool and choosing Angle Counterclockwise.
I then tightened up each of the columns. You can see the result here:
It's okay, but it needed a little somethin' somethin'. It needed the header background to be on an angle, too.
This next step is probably my favorite because Excel delivers an awful lot of bang for your click. Just head up to the border tool. All of a sudden, not only do you get a border, but it angles the entire header. Be sure to select the all borders, as well as the border color (which I made green).
Then I hit Center Text and Bottom Align to make sure the text fits in the angled headers nicely:
The table is becoming nicer, but it's still dense. To make it easier to parse how the different elements relate, I wanted to segment the spreadsheet into different areas.
This is actually pretty straightforward. All I did was add rows and columns, and then shrink them down.
Once I added the columns, I made sure to select them with the Control key, then set them back to a white background and dragged left to make them narrow and all the same width.
I did exactly the same process with the rows. Here's the result.
This is a good time to get rid of the gridlines. That's done by selecting the Page Layout tab and unchecking View under Gridlines.
We're coming down to the final stretch. All that's left is showcasing how the processor cores perform relative to each processor family. This will span the base M processor as well as the Pro and Max models -- but not the Ultra. To make it clear that the Ultras are not included, we're going to shade those two columns.
Also: MacBook Pro (M3 Max) review: A desktop-class laptop for an AI-powered age
This probably would have been easier before segmenting, but you can't have everything in life. Instead, I control-clicked all the cells under Ultra that are not the separator lines. Then I selected More Colors under the Paint Bucket, selected the electric green color, and simply slid the darken slider to the right a bit. This keeps the color hue but changes its overall brightness.
Now it's time to do some Excel magic. I selected the three Relative Performance blocks under CPU performance cores. I again used the Control key to selectively choose my cells:
To make the cells act as one, I chose Merge Cells under the Merge & Center button:
I left-aligned the cells to push the number to the left side. Then, under the Conditional Performance section, navigate to Data Bars, and then Solid Fill. I chose Blue.
Then I changed the text color to white and the number format to percentage. After that, under the Conditional Formatting icon, I chose New Rule, set the style to Data Bar, and then set the positive value color to the more vivid blue that is 's highlight color.
All that's left was to follow the same process for the CPU efficiency cores and the GPU cores.
Also: How to use ChatGPT to write Excel formulas
We're done. Although it takes some fiddling, Excel provides some powerful formatting tools that can help you produce great-looking tables.
If you build any cool charts or tables using Excel, let us know in the comments below. I'd love to see what you create. Have fun!
You can follow my day-to-day project updates on social media. Be sure to subscribe to my weekly update newsletter on Substack, and follow me on Twitter at @DavidGewirtz, on Facebook at Facebook.com/DavidGewirtz, on Instagram at Instagram.com/DavidGewirtz, and on YouTube at YouTube.com/DavidGewirtzTV.
 Hot Tags :
Our process
Home & Office
Work Life
Productivity